What the gun-crime number is made of
Statistics Canada counted 14,488 firearm-related violent crimes in 2024. One combined category contains 4,548 of them and supplied about half the ten-year rate increase.


Statistics Canada counted 14,488 police-reported firearm-related violent crimes in 2024. That works out to 36.0 incidents per 100,000 people and 2.6 per cent of violent crime.
One row deserves to travel with that total. Police coded 4,548 incidents as involving a firearm-like weapon or an unknown type of firearm. The combined category accounts for 31.4 per cent of the national count.
It also supplied about half of the increase in the published rate between 2014 and 2024.
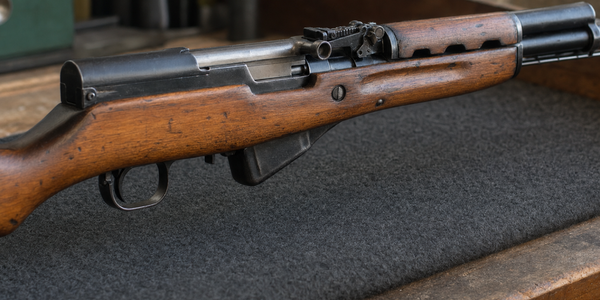
Holdover produced the feature as a fictional owner reading a statistical table beside a generic air-pistol family archetype. The person, object, paper, and room do not depict a Statistics Canada incident, police exhibit, named owner, exact product, or classification decision.
What sits in the fourth row
Table 3 divides the 2024 incidents into four groups. Handguns account for 7,068. Rifles and shotguns account for 2,098. Fully automatic firearms and sawed-off rifles or shotguns account for 774. The fourth group contains 4,548.
Statistics Canada says that last category may include airsoft, BB, pellet and other air guns, replicas, and unlawfully manufactured firearms, including 3D-printed firearms. It also covers incidents where police knew a firearm was present and could not identify its type.
The report's note sets a hard limit on interpretation. The data cannot tell us which records involved firearm-like weapons and which involved an unknown type of firearm. The combined number supports no finer split.
I own a blowback Umarex air pistol and a CO2 less-lethal pistol. In the hand or on a bench, each has physical details an owner can inspect. An incident report can begin with a witness, a threat, poor light, distance, and an object that was never recovered. The silhouette does not settle the fourth-row coding problem.
Half the ten-year rise
The national firearm-related violent-crime rate rose from 25.0 per 100,000 in 2014 to 36.0 in 2024. The combined firearm-like or unknown rate rose from 5.9 to 11.3 over the same span.
That category therefore added 5.4 points to an overall increase of 11.0. The arithmetic puts its contribution at 49.1 per cent. “About half” is the honest way to carry that result because Statistics Canada publishes the rates to one decimal place.
The incident counts tell the same broad story. The combined row grew from 2,029 incidents in 2014 to 4,548 in 2024, a rise of 124 per cent. Its label still prevents us from assigning that growth to replicas, air guns, homemade firearms, or unidentified conventional firearms in any particular proportion.
That uncertainty matters when the total is used to argue for policy aimed at a specific object or owner. A category broad enough to hold several materially different things cannot prove which one drove its movement.
The trend that remains
Removing the combined row does not flatten the series. The three identified types add to 19.1 per 100,000 in 2014 and 24.7 in 2024. Using the published rounded rates, that is an increase of about 29 per cent.
Handguns remained the largest identified category at 7,068 incidents in 2024, with a rate of 17.6. Rifles and shotguns reached 2,098 incidents and a rate of 5.2. The fully automatic or sawed-off group reached 774 and 1.9.
An honest ownership argument has to carry both findings. The combined category is large enough to change how the headline trend should be read. The identified categories also rose enough to rule out the easy claim that the entire increase is a classification artifact.
What the report can support
Statistics Canada records several changes running in different directions. Firearm-related homicide declined in 2024. Police reported 1,699 non-violent firearm theft incidents, down from 3,568 in 2014. Among accused people in firearm-related homicides from 2009 through 2022, 80 per cent did not have a valid licence for the class of firearm recovered.
The sourcing data carry their own limits. In the subset of 152 recovered firearms where legal ownership status could be determined, 37 were legally owned. Statistics Canada warns that the result covers a small selected share of all recovered firearms and cannot represent every firearm used in crime.
Those rows point toward harder questions about illicit sourcing, repeat violent offenders, theft, domestic manufacture, and the parts of police reporting that remain unresolved. They also show why a single national total cannot choose a policy on its own.
The useful number is 14,488. The useful reading carries the 4,548 inside it, the category definition beside it, and the 29 per cent identified-type rise that survives the correction.
Sources
- Statistics Canada, Firearms and violent crime in Canada, 2024, released April 21, 2026.
- Statistics Canada, Table 3: Police-reported firearm-related violent crime, by type of firearm present, Canada, 2014 to 2024.
- Statistics Canada, The Daily: Firearms and violent crime in Canada, 2024, April 21, 2026.
The amnesty file is still moving.
If this piece sent you back to government pages, do not wait for the next portal, Gazette, or court move to find you by accident.
The Dispatch follows Public Safety, RCMP, Canada Gazette, court, compensation, collection, and amnesty updates so the next change comes with the source that moved.
Safety note: the tracker is a worksheet for source hygiene, not legal advice or a substitute for current official guidance.